
Goal
For this competition, each participant will have to create a method which enables to scan a document in video mode, and reconstruct a high-quality image as if the document was captured using a perfect scanner. Participants will be exposed to realistic input data captured by hand from multiple users using various devices. Furthermore, documents will exhibit various challenges as large size, reflective surfaces, text and graphic content. Finally, capture conditions will also be challenging with blurry frames, indoor and outdoor captures, various illumination conditions (both direction and intensity), and variable motions (to try to remove highlights, to “dig” into details by bringing the document closer, etc.).
Participants will therefore have to face both a stitching problem and a restoration problem.
To ensure the problem is tractable and results can be evaluated, some extra information will be provided with the input sequence of images:
- the target resolution and the shape of the image to produce;
- and the coordinates of the region of interest on the first or a separate frame.
 This tasks will be evaluated while keeping in mind that the goal of such process should be to capture and archive clear and readable image for humans. OCR and other automated processing should also be performed on such images, but in order to keep evaluation simple, we want to focus on readability improvement and chose metrics accordingly, among standard ones.
Input specification
Data to process will be organized as a set of acquisition samples. Each input sample will consist of:
- A sequence of images containing all or a part of the document to capture. This sequence will be a video in the MP4 format, at variable resolution (depending on the device) without sound, with low compression, at approximately 25 FPS and with a duration between 4 and 15 seconds. This will represent between 80 and 400 frames to process. Frames can be blurry, have occlusions and highlights, and contain only a fragment of the document.
- The precise coordinates and labels (top-right, top-left, etc.) of the corners of the rectangular and planar document to restore, either in the first frame or in a later on where the document is mostly visible and mostly sharp. This frame and the related coordinates will be provided separately in PNG format for the image, and JSON format for the coordinates.
- The target resolution and shape of the image to produce, ie the width and height in pixels of the canvas to paint with a high resolution and defect-less version of the area described by the previous coordinates.
Data structure
Data will be provided as a FTP archive containing the following file hierarchy:
icdar_smartdoc17_reconstruction/
├── sample01/
│   ├── ground-truth.png ## Training set only!
│   ├── input.mp4
│   ├── reference_frame_00_dewarped.png
│   ├── reference_frame_00_extracted.png
│   ├── reference_frame_00_extracted_viz.png
│   └── sample.json
├── sample02/
│   └── …
├── …
└── sample30/
   └── …
Files descriptions and formats
- ground_truth.png
- Description: Ideal image your method should produce. Included in training/demo dataset only.
- Format: PNG image with 3 channels (RGB, no alpha) “Truecolor” (no indexed colors) @ 8 bits / channel, sRGB color space, no embedded ICC profile. Embedded ICC profiles will be ignored, and values will be assumed to be encoded with sRGB even in the absence of specific file header.
- input.mp4
- Description: Video stream which should be processed by your method to produce an image as close as possible to ground_truth.png.
- Format: No audio stream, 1 video stream: mpeg4 container, H264 encoding, yuv420p color format, variable frame-rates. Frame size may be different from one video to another, but we will target native video recording resolution from smartphones which usually is full HD (1080p).
- reference_frame_NN_dewarped.png
- Description: Image of the same shape as the ground truth image: participants should use either the shape of this image or the shape provided in task_data.json to find the exact shape of the image they must generate. Other shapes will results in a failure to evaluate the result. This dewarped image is generated by “undoing” (“unwarping”) the perspective transform the ground truth image has suffered, back-projecting the relevant image area into the target image shape.
The “NN” value in the name indicates that this frame was the NN-th frame of the video (0-indexed). It usually means it was the first exploitable frame we found when generating the task. For most of the videos this will be “00”, but you should not assume so. - Format: Same as ground_truth.png
- Description: Image of the same shape as the ground truth image: participants should use either the shape of this image or the shape provided in task_data.json to find the exact shape of the image they must generate. Other shapes will results in a failure to evaluate the result. This dewarped image is generated by “undoing” (“unwarping”) the perspective transform the ground truth image has suffered, back-projecting the relevant image area into the target image shape.
- reference_frame_NN_extracted.png
- Description: The exact same frame from the video input which was “unwarped” to produce the “dewarped” version.
- Format: Same as ground_truth.png
- reference_frame_NN_extracted_viz.png
- Description: Same as reference_frame_NN_extracted.png, but with an extra visualization of the outline of the object to track drawn over the image.
- Format: Same as ground_truth.png
- task_data.json
- Description: An easy-to-parse file which contains a summary of important coordinates and shapes of: the image to produce (target_image_shape), the input video frame (input_video_shape), the object to track (object_coord_in_ref_frame) along with the id of the frame used as a reference (reference_frame_id).
- Format: JSON file similar to the example below.
Example of task_data.json file
{
  "input_video_shape": {
    "x_len": 1920,
    "y_len": 1080
  },
  "target_image_shape": {
    "x_len": 3508,
    "y_len": 2480
  },
  "object_coord_in_ref_frame": {
    "top_right": {
      "y": -22.679962158203125,
      "x": 1535.1053466796875
    },
    "bottom_left": {
      "y": 830.49786376953125,
      "x": 568.02178955078125
    },
    "bottom_right": {
      "y": 985.6279296875,
      "x": 1526.2147216796875
    },
    "top_left": {
      "y": 177.77229309082031,
      "x": 546.0078125
    }
  },
  "reference_frame_id": 0
}
Notes:
- Point coordinates are float lists with x then y coordinate in pixels. Decimal separator is the dot (“.”) and there may be no decimal part.
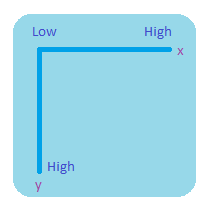
- The coordinates are expressed in the referential where the origin is at the top left of the image, x axis is horizontal (positive toward right) and y axis is vertical (positive toward bottom) — see illustration below.
- Coordinates may fall outside frame area because of a small part of the document being out of frame.
- Target shape is an integer list [width, height] expressed in pixels.
- Frames are 0-indexed (first frame of the video has id 0).
Expected output
The methods under test will have to produce a high resolution and defect-less version of the document, as similar as possible to the original document digital raster version, at the resolution specified as input. This image will be encoded in PNG lossless format.
Target resolutions should be expected to be in the range of 600 DPI for small documents (smaller than ISO A4 / Letter), 300 DPI for A4 / Letter documents, and 150 DPI for posters.
Color encoding must be sRGB, and make use of the full range of possible values. Typically, a restored version of a document printed on a white page should contain an important number of pixels with value (255, 255, 255).
Data structure
Participant results will have to be comply with the following file hierarchy:
icdar_smartdoc17_reconstruction/
├── sample01.png
├── sample02.png
├── ...
└── sample30.png
File formats
- sampleXX.png
Same as ground_truth.png and ref_image.png from input data.
Evaluation and ranking of methods
The evaluation process for each pair (result image R, target image T), will work as follows.
- We register the two images precisely using local descriptors (SIFT in this case).
- We compare the signal of both images with a standard full-reference image quality assessment measure which was proved to exhibit a high correlation with human perceived quality. In order to give more importance to the preservation of characters shape than color accuracy, we will use a well-known windowed variant of the Structural Similarity (SSIM) measure. This measure considers the luminance channels of the images to compare and focuses on the dynamic of the signal rather than computing an intensity difference.
- The cumulated histogram of the windowed measured values will be computed and the area under the curve will be normalized and compared with a baseline to express a gain in dB.
The baseline used as a reference will be the interpolated image of the reference frame for which the document outline was provided.
The global score of each method will be computed as the average gain over the baseline, along with a confidence interval.
The final ranking of participants will be performed according to the global score their best method gets, provided the confidence interval allows us to discriminate among the methods. They will indeed be allowed to submit results for more than 1 method.
References:
- R. Sheikh, M. F. Sabir, et A. C. Bovik, « A statistical evaluation of recent full reference image quality assessment algorithms », Image Processing, IEEE Transactions on, vol. 15, nᵒ 11, p. 3440–3451, 2006.
- Z. Wang, A. C. Bovik, H. R. Sheikh, et E. P. Simoncelli, « Image quality assessment: From error visibility to structural similarity », Image Processing, IEEE Transactions on, vol. 13, nᵒ 4, p. 600–612, 2004.
Test set content
A new dataset will be created for this competition. It will be released first to participants after the competition, then publicly during the conference.
It will consist in 30 to 50 document “samples”. Each document will be captured only once, to prevent participants from using redundancy in a way which would be incompatible with the target use cases.
Invariants
Documents will be constrained to be planar and rectangular (no bottle labels, for instance). Small non-planar variations (because a paper sheet is not exactly flat) will be coped with by the evaluation process to ensure local alignment between ground truth and participant results.
Variables
- Documents types will be: conference posters, receipts, reflective documents (ids specimens for instance), projected slides.
- Users will be members of the lab or relatives, having different behaviors.
- Devices will be regular devices used by lab members
- Illumination will be realistic, with mostly indoor captures but also some outdoor ones.
- Blur will necessarily be present but will not be intentional.
- Motion will be realistic, with different uses cases: orientation variation with full document visible (to try to remove highlights or occlusion for example), sweep over the document (long receipt for instance), dig into details (for posters, or when ambient conditions produce blurry details).